Performance Measures
Performance-Based Planning Framework
Wasatch Choice Performance Monitoring
The Wasatch Choice Vision is our region's shared blueprint for how we grow - bringing together plans for transportation, housing, parks, public spaces, and thriving city and town centers. When these elements work together, they help us achieve something we all care about: better access to opportunities - whether that’s a good job, quality housing, recreation, or community connections.
To track how well we’re moving toward this vision, WFRC created a performance monitoring program. This program looks at long-term trends in the four key areas of the Vision and uses the “Big Five” measures to provide a clear picture of our Region’s progress. By keeping an eye on these measures, we can see where we’re making great strides and where more work is needed—helping communities, counties, and the entire Wasatch Front grow stronger together.
Access to Opportunities (ATO)
A basic purpose of our transportation system is to efficiently connect residents to activities and destinations. Access to opportunities, also referred to as accessibility or ATO, is a way to measure how well people can connect to basic needs and amenities including jobs, schools, grocery and other retail, parks, community centers, recreation, and entertainment.
Measuring current and future ATO is an important component to both the development and implementation of the Wasatch Choice Vision for our Region. Broadly, ATO metrics quantify how well the current and future transportation system works with land use to help our economy thrive.

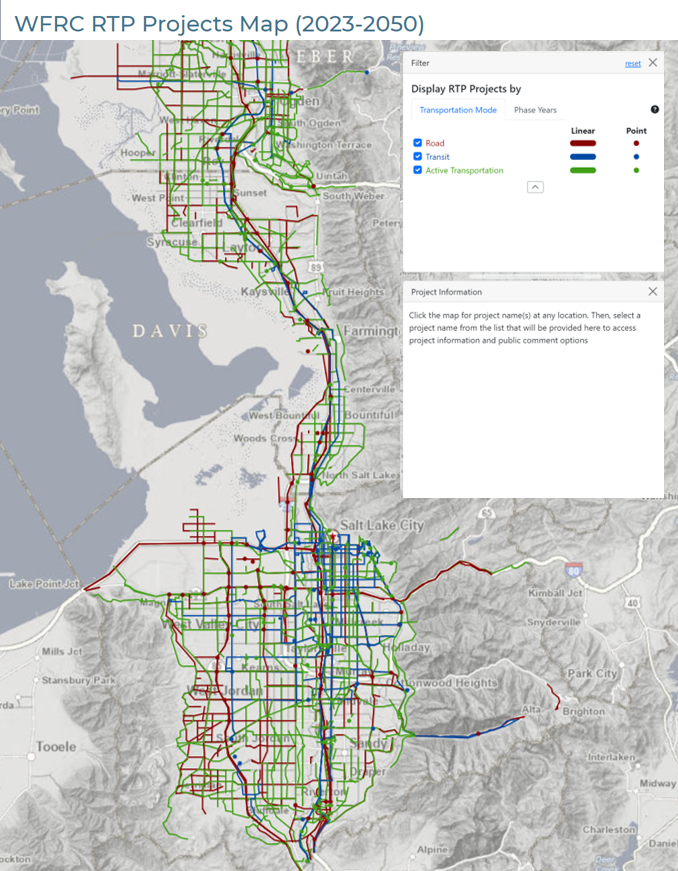
Regional Transportation Plan
Performance measures were carefully developed in collaboration with our local communities and transportation partners to give decision makers the opportunity to compare how well the 2023–2050 RTP supports their values and goals. The 2023–2050 RTP was evaluated to determine its social, economic, and environmental impacts and how well it would meet the transportation needs of the Region through the year 2050.
Project Selection
During the development of each RTP, project selection criteria is used to evaluate each project and, in conjunction with feedback received from the public involvement process, move towards a preferred scenario.
WFRC creates project selection criteria in close collaboration with transportation partners and local communities using Wasatch Choice Vision goals, federal performance measures, and other performance factors.
Needs-Based Phasing
Phasing of RTP projects is guided by the Wasatch Choice Vision goals. These goals inform the criteria, weighting, and methodology used to phase projects, and differ slightly by transportation mode. WFRC uses a variety of tools to forecast the timing and impact of anticipated growth, such as the regional Travel Demand Model and the Real Estate Market Model. Forecasts from these models, and other technical data and input from WFRC’s partners, including the Utah Department of Transportation (UDOT), Utah Transit Authority (UTA), and local communities, are used to assign points to each transportation project in the near- and long-term time horizon.
RTP System Performance
WFRC’s Regional Transportation Plans (RTPs) are evaluated to assess their social, economic, and environmental impacts, as well as how effectively they address the Region’s future transportation needs. The goals and objectives of each RTP form the foundation for this evaluation, which also considers conformity with state air quality plans and other relevant factors.
For the 2023–2050 RTP, the regional performance summary shows that, with the recommended investments, the Region will enjoy improved accessibility, mobility, and transportation choices by 2050 compared to a no-investment scenario. Notably, the plan supports substantial increases in transit ridership across the Region and encourages positive shifts in mode share for walking, bicycling, and transit use. The recommended project list includes robust and varied projects to expand economic access, broaden travel options, and sustain a high quality of life for residents and visitors alike.
Federal Performance Measures
Two federal acts – Moving Ahead for Progress in the 21st Century Act (MAP-21) and Fixing America’s Surface Transportation (FAST) – provided a performance management framework for state departments of transportation, transit agencies, and MPOs to assess and monitor the performance of the transportation system. Outlined were seven national performance goals for the Federal-aid highway program and two national performance goals for transit agencies. Each DOT, transit agency, and MPO is required to coordinate together to set performance targets and report on progress toward meeting national goals and agency targets.
Highway Performance Goals
To achieve a significant reduction in traffic fatalities and serious injuries on all public roads.
- Number of fatalities
- Rate of fatalities per 100 million vehicle miles traveled
- Number of serious injuries
- Rate of serious injuries per 100 million vehicle miles traveled
- Number of non-motorized fatalities and serious injuries
Transit Performance Goals
- Total number of reportable fatalities and rate per vehicle revenue miles by mode
- Total number of reportable injuries and rate per vehicle revenue miles by mode
- Total number of reportable events and rate per vehicle revenue miles by mode
- Mean distance between major mechanical failures by mode
Resources
Contact
For additional information, please contact:

Julie Bjornstad
Long-Range Planning Deputy
Director